Go back!


Preserving Colors in Color Composites

© Till Credner 1999
Max-Planck-Institut für Aeronomie

Before you go on reading, please be acquainted with the following terms:
  • Color Definition
  • Three Color Composite

    The Problem of Losing Colors

    The usual way of additional combining three images to an RGB-image suffers from loss or even fake of color information. It is common to enhance contrast and faint features in images with nonlinear look-up tables, for example a logarithmic intensity scaling. But doing this to the three channels of an RGB-image changes the channel ratios, i.e. the colors are not preserved. Normally the colors become more neutral (grey), i.e. the channels equalize. This also happens to the human eye and conventional photographies if a nonlinear response or even saturation is reached. Stars do appear white on images due to nonlinear scaling and not just because of detector saturation! A very big advantage of modern CCD detectors is their linearity over a large dynamic range. But with the usual way of nonlinear constructed RGB-images we throw away most of the scientific color information. Realizing this problem I have constructed a method of image RGB combination that preserves the original colors as shown in the following example:


    The Open Star Cluster NGC 1245, with preserved colors (left) and as conventional RGB composite (right).
    Intensity scaling (cubic root) and cuts are chosen identical.

    Intensity and Chromaticity Values

    To understand and solve the problem some quite easy mathematics has to be applied. Every original color picture element (pixel) is given by an RGB color triple (R, G, B) with the including intensity values for red, green, and blue. The total intensity I is the sum of these channels
    I = R + G + B.

    The colors or more exactly the chromaticities of the RGB-model are given by
    r = R / I = R / (R + G + B)
    g = G / I
    b = B / I.
    The chromaticity values express in percent how the total intensity is distributed to the three channels. These values can be equal for different intensities and range always from 0 to 1 (r + g + b = 1 !). In the RGB chromaticity triangle all available values are shown with the maximum possible total intensity:

    RGB Chromaticity Triangle

    For example (r, g, b) = (0, 0, 1) is the lower left blue corner. (1/2, 1/2, 0) is the pure yellow between the red and green corner. And in the center of the triangle we have white with (1/3, 1/3, 1/3). These chromaticity values are equivalent to the physical and astronomical color definition, i.e. they are defined by the intensity ratios of the channels. But note that the physiological chromaticity diagram is quite different, because the human eyes three primary colors are somewhat shifted from the RGB colors. The eye can see more colors than your monitor or printer can show and the RGB chromaticities are just a gamut (subspace) of the CIE Chromaticity Diagram.

    Changing of chromaticities with nonlinear scaling

    The problem of conventional color composites is that nonlinear scaling of an RGB-image is changing most of the chromaticity values. If you enhance faint features for example with a cubic root function the colors change from the above shown chromaticity diagram to the following:

    RGB Chromaticity Triangle after scaling with cubic root

    The colors are "washed out"! The colors become more neutral because the channels equalize. And so color information is lost.
    A particular problem with functions where f(a)/f(b) not equal to f(a/b) is that the same colors with different intensities become different colors after scaling! Here an example of logarithmic scaling of intensities from 1 to 50 and from 1 to 5000:


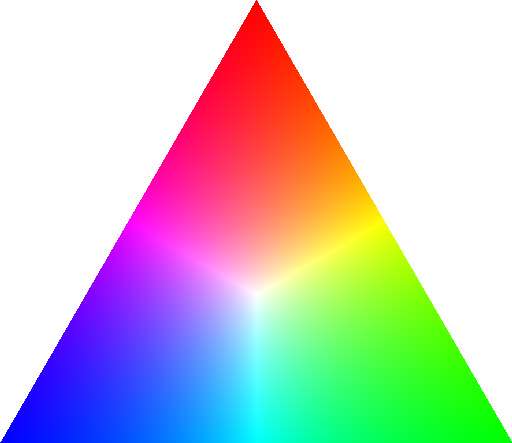
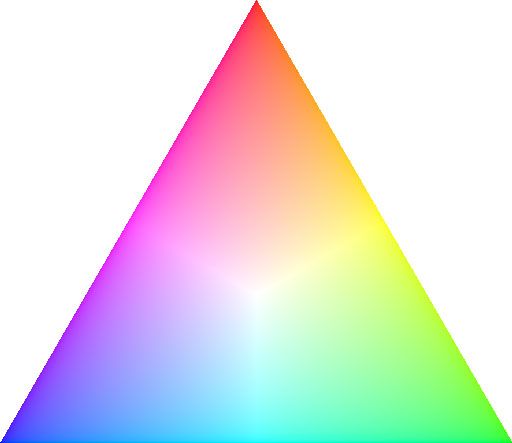
    RGB Chromaticity Triangle
    after scaling with logarithm

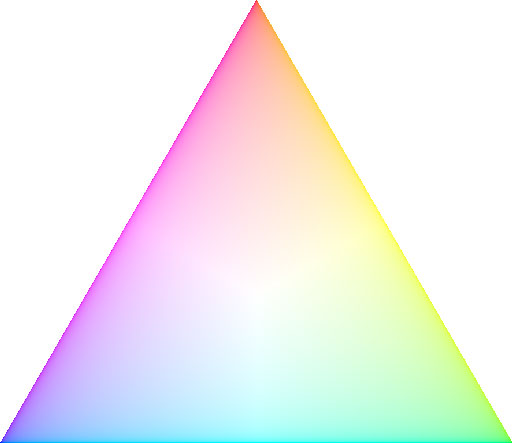
    RGB Chromaticity Triangle
    at 100th intensity after scaling with logarithm
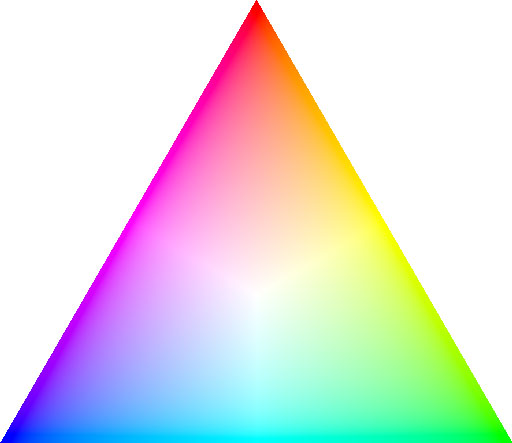
    And so objects with the same colors become different colored objects in the color composite!

    Processing with preserved colors

    The idea now is to preserve the position in the chromaticity triangle, whatever you apply to the image. The total intensity and the chromaticity values are calculated as written above from the data (after all stuff like background subtraction and color balance has been done). Then just the intensity image is processed for an optimized view with nonlinear scaling, upper and lower cuts, unsharp masking, or whatever. The chromaticity values stay the same to show the original colors of the astronomical objects. After this intensity processing the image is recombined to an RGB image again:
    Rnew = r * Inew
    Gnew = g * Inew
    Bnew = b * Inew
    This method is similar to image processing in the HSV (Hue, Saturation, Value) color model, whereas Value is quite different to the above intensity definition and not equivalent to the physical definitions (Value=maximum(R, G, B)). Also other similar models are available for example HLS (Hue, Lightness, Saturation), LRGB (Lightness, Red, Green, Blue) or L*a*b (Lightness, a&b color information), whereas all these models use different color definitions that are not equivalent to the scientific values and show the "wash out" effect at increasing intensities.

    Results

    The resulting images show much "stronger" colors then before. The spectral star classifications are easily visible to everyones eyes. You see the "true physical" colors of the stars (having in mind the used filters!). The aim of this method is NOT to give the "natural" physiological color impressions as our eye would see it. The aim is to show the maximum astrophysical content of the observations in one image!
    But some unconvenient points have to be said:
  • This method is extremely sensitive to the channel matching. The positions and point spread functions of the three RGB-images must match and no saturations are allowed, as they would fake the colors. Smoothing the color information helps somewhat.
  • Another thing is that many bright intensities must be scaled down to be able of showing the original color. This makes the overall image appearance somewhat darker. But this can be switched off so that stars appear in the usual white in the center, but at least show the right colors in the surrounding (see for example the image of NGC 2266).
  • And third you should be aware, that not just your eyes, but also your monitor and printer are using a nonlinear look-up table, i.e. a logarithmic scaling to present different intensities in a similar way the human eye and brain works. But with the above method we at least can eliminate the color loss due to image processing.

    But in all I think it is very worth it. Just in this way you can see the maximum original color information of your astronomical data.


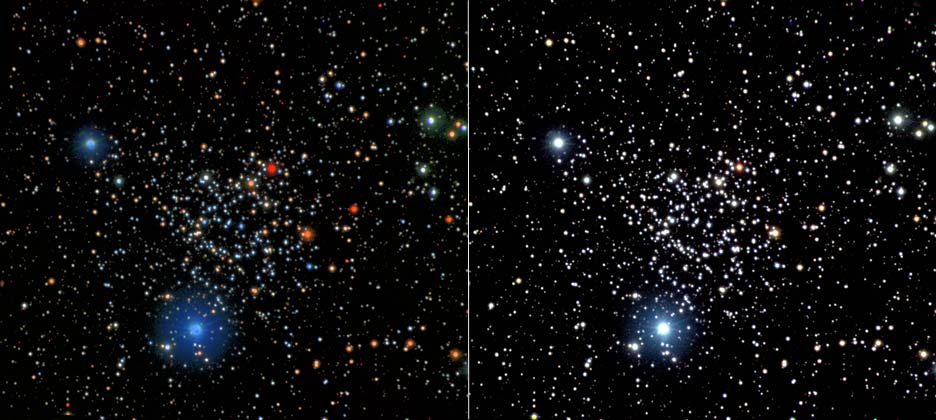
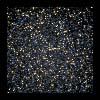
    Center of the Globular
    Cluster Omega Centauri

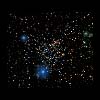
    Open Cluster NGC 1245
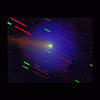
    Comet Wirtanen
    More images with preserved colors

    All images are clickable to get the whole HTML-document with description and larger image size.

    References
  • Foley, J. D., et al., 1996, Computer graphics: principles and practice, Addison-Wesley, 563-604
  • Kaiser, P. K., 1999, The Joy of Visual Perception: A Web Book, York University
  • Kylander, K., Kylander, O. S., GUM, The GIMP User Manual
  • Malin, D., Murdin, P., 1984, Colours of the Stars, Cambridge University Press, 198

    © all photographs taken by Till Credner and Sven Kohle